How was inflation in 2023 for poor and rich households in Spain?
Ángel Martínez, Javier Martínez Santos
9 Jan, 2024
Key ideas
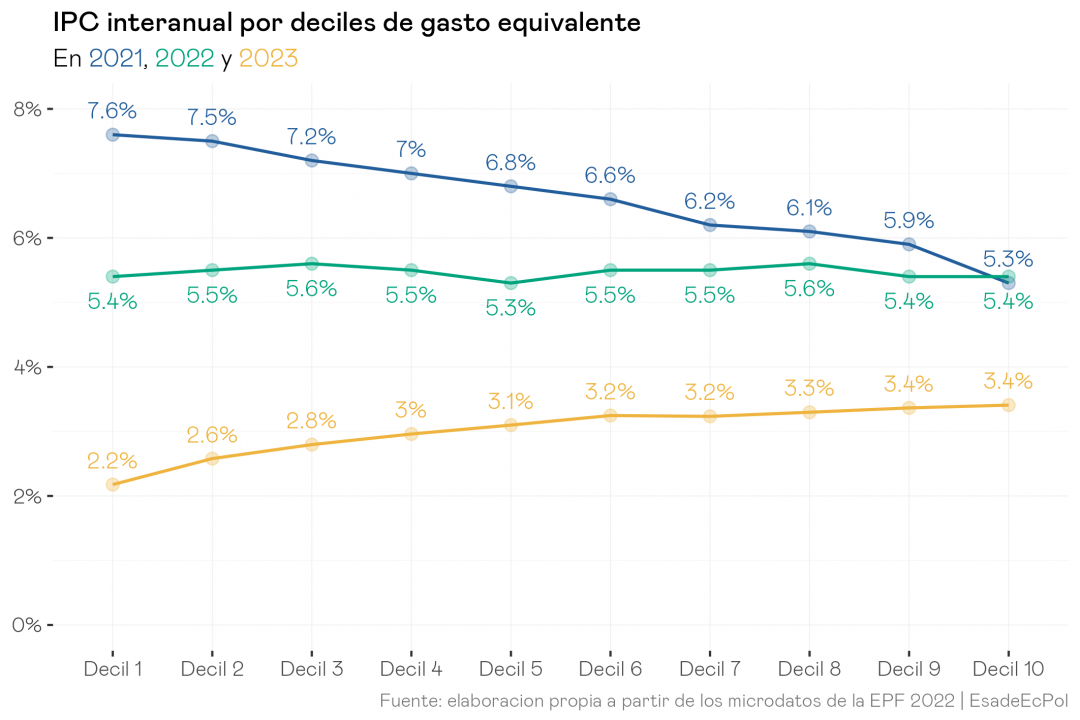
→ In 2021 the CPI of the poorest households was substantially higher than that of the richest households due to higher electricity prices. In 2022 it started to equalize, and in 2023 it has come full circle with an opposite picture: the CPI is lower for households with fewer resources.
→ The reason lies mainly in the fall in the price of electricity and gas, driven by the tax rebates at the beginning of 2023.
→ Food and fuels are the components that have pushed up the CPI of the poorest households the most; for the richest it has been the growth in the prices of catering, accommodation services and the rest of the goods.
→ The gradual withdrawal of tax cuts on electricity and gas over the course of this year, if implemented, will change the picture of inflation by income bracket in 2024.
As in every new year, it is time to evaluate the balance caused by inflation over the past year and, more specifically, how this balance has varied among households according to their economic capacity. In 2021 we saw that the balance was tremendously negative for those with fewer resources due to the increase in electricity prices. In 2022 the situation was substantially different, with a very homogeneous year-on-year CPI rate among the different groups of households, precisely because of the start of the fall in electricity prices and the growth of restaurant and transport prices, especially vehicle purchase prices. And this year the outlook has changed again.
As always, it is worth starting by clarifying certain concepts about the CPI. Although it is usually treated as a single figure, the truth is that it is still a weighted average, based on the composition of the average Spanish household’s consumption basket. If households spend a higher percentage of their budget on a group of goods, any change in their price will have a greater influence on CPI variations. To observe this, using micro data from the Household Budget Survey (2022), we divide Spanish households into ten groups according to their level of equivalent expenditure (which will serve as a proxy for their income). We calculate, for each of these groups from the 10% with the lowest economic capacity (decile 1) to the top 10% (decile 10), what has been the year-on-year CPI they have endured in 2023, taking the consumption baskets of each group. 2023 brought a year-on-year inflation of 3.1%, substantially lower than the 5.4% of 2022, which was also increasing according to the household’s economic capacity, i.e.: those households with greater purchasing power faced a higher growth in their prices compared to the rest. Although this difference is modest in percentage points (1.2 percentage points difference between deciles 1 and 10), it is not so in relative terms, since the CPI experienced by the poorest households would be about 33% lower than that of the richest households in the last year.
To understand why 2023 has left us with this snapshot we can decompose the year-on-year variation of each decile among the different groups of goods that have contributed most to it, either positively or negatively, so that the sum of all their values yields the values associated with the year 2023 in the graph above. This graph is relatively similar to the one that would correspond to the year 2022, but there are changes that imply that we go from a year with very few differences in inflation by deciles to one with substantial differences, and an increasing trend. First, the sum of the positive values in each decile is no longer decreasing, as it was in 2022. Although food and non-alcoholic beverages have again been a key element of inflation this year, especially among the poorest households, price growth in restaurants, fuels and the rest of the goods and services have pushed up the CPI of better-off households enough to correct the regressive effect played by food.
Secondly, the drop in the price of electricity has once again played a key role, substantially reducing the inflation rate faced by the poorest households while leaving that experienced by the better-off practically constant. In addition, electricity has been joined this year by gas, albeit much more modestly in quantitative terms, reducing the CPI especially among the poorest. The sum of both (positive inflation barely differential between deciles and negative inflation in two key products highly biased towards the lower deciles) is what has left us with the growing trend of the CPI with the economic capacity of the household in the past 2023.
The above graph can in turn be decomposed into two parts, since the contribution of each category of goods to the CPI is nothing more than the result of multiplying its price change by its weight within the monetary (i.e., basket) expenditure of each decile. Knowing this, the following two graphs indicate which part of this multiplication has contributed the most in each case. For example, it is clear that, in the case of food, whose price has more than doubled with respect to the CPI average, the predominant reason has been its enormous weight in the household budget, which is close to 30% for the poorest households. On the opposite side, for electricity and gas, the most contributing factor has been their drastic price change in 2023, which has fallen by almost 20%, since their weight on total expenditure is rather modest compared to the rest of the items.
In short, 2023 has closed the circle that opened in 2021 with the tremendous increase in the price of electricity, helping to offset its fall in 2022 and 2023 with the growth in the price of food and other relevant items. It is worth noting that the effect that electricity has played in the last two years (and gas in the last one) has been decisively supported by tax cuts in VAT and other taxes that, let us remember, will be increased this year. If the pending decrees are approved, VAT on electricity would rise from 5% to 10% and the excise tax on electricity would increase from 0.5% to 2.5% in the first quarter of the year and to 3.8% in the second quarter. VAT on gas, from 5% to 10%, with the difference that it will increase again to the original 21% as of April 1. As we have already seen in past documents, these tax cuts were, in general terms, quite inefficient in distributive terms with respect to other policies such as the MVI, as they had no way of discriminating by income and, additionally, distorted the price signals needed to encourage energy savings. Even with all of the above, their withdrawal will contribute to reducing the equalizing effect that these two goods have had in 2023, and opens the door to their positive contribution to the CPI in 2024. Therefore, the use of these new taxes reintroduced by the state will ultimately determine the final balance for many households in the new year.

Economista enfocado en el análisis y la visualización de datos. Grado en Administración de Empresas y Economía Laboral por la Universidad de A Coruña y Master en Economía por la Universidad de Santiago.
View profile


